![Untitled design (55).png]](https://help.yourhere.ca/hs-fs/hubfs/Untitled%20design%20(55).png?height=50&name=Untitled%20design%20(55).png)
The youRhere CMS allows you to view at-a-glance how your users are interacting with the software you have on site. You can even export and download that data for further insight and use.
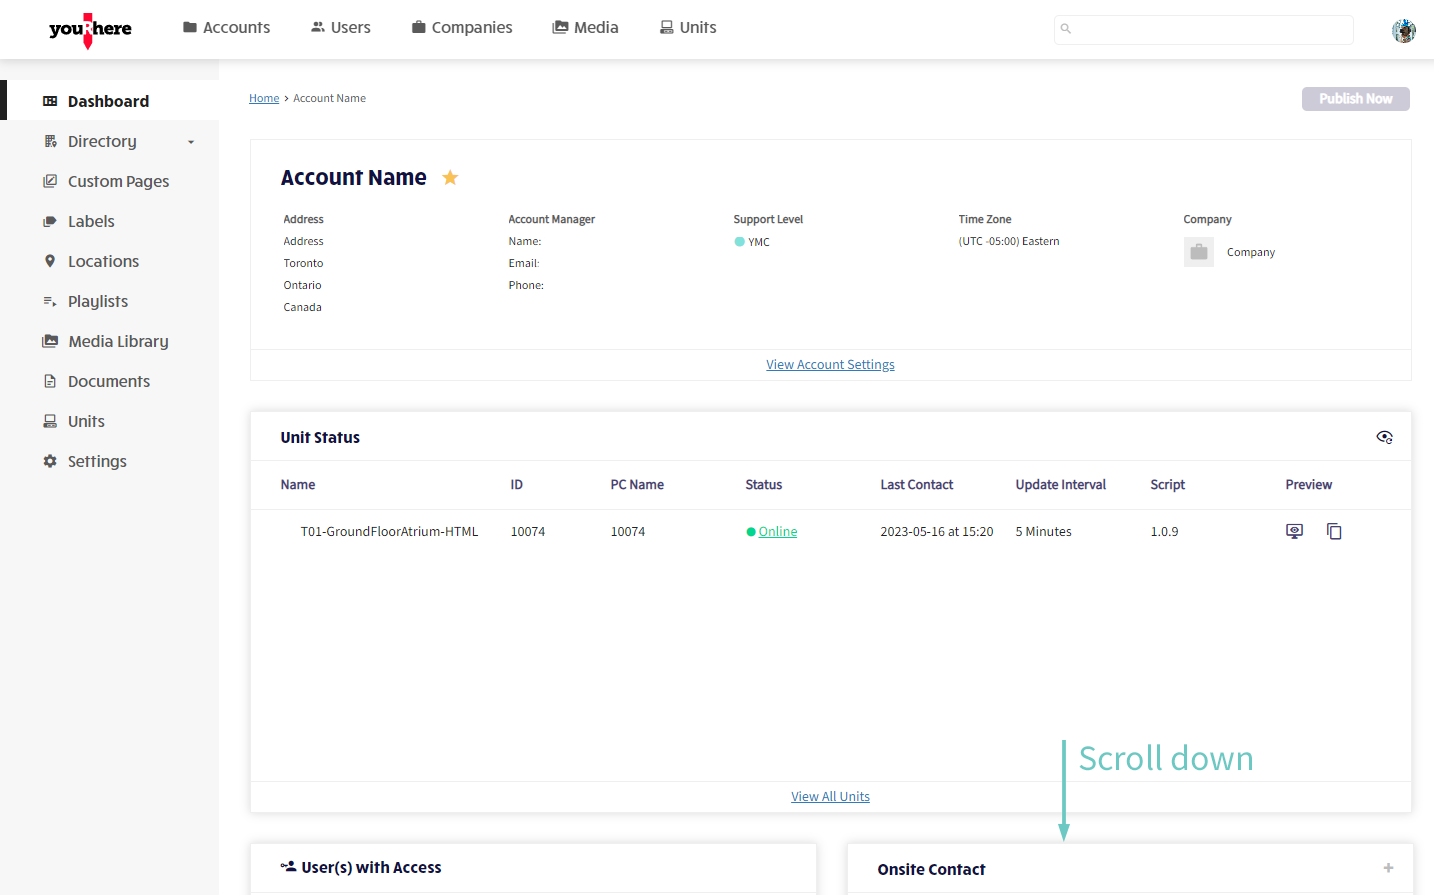
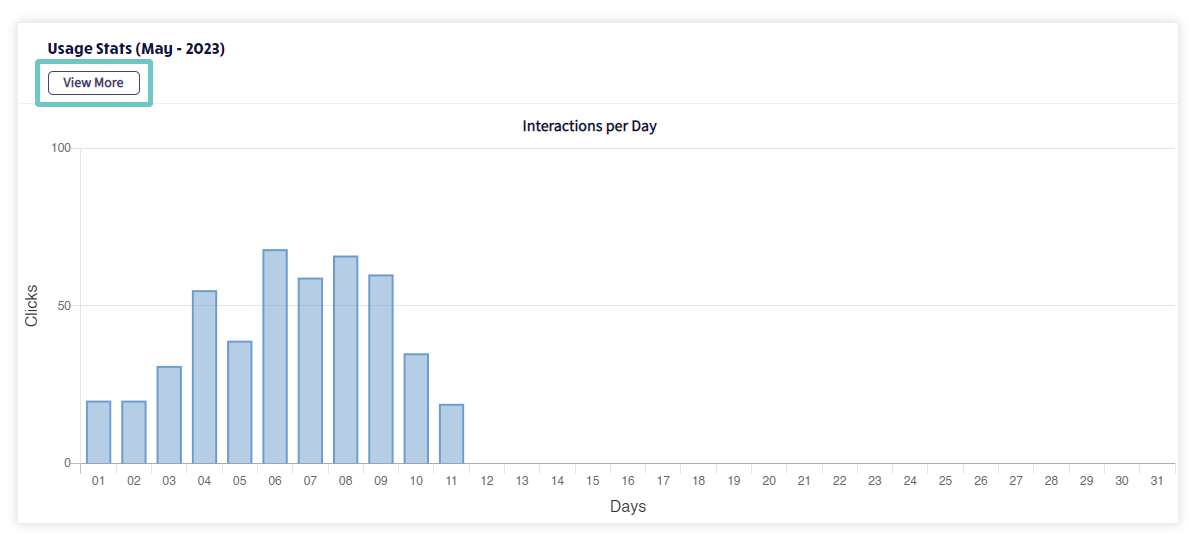
After logging in to your account, you can navigate to the Stats either by scrolling down on your account Dashboard and clicking to View More, or by clicking Stats in the side navigation as below. The Dashboard view itself shows basic information about how many interactions the hubs experience daily, with information from as recent as the day prior.
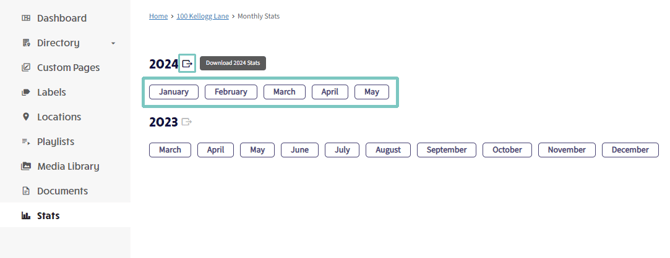
From here, we can either download the usage stats for the whole year, or view stats by month. The download will be a zipped file including raw data in spreadsheets for each month in the year.
Each view by month will firstly include daily clicks, and the option to download a spreadsheet or print the data in the top-right corner.
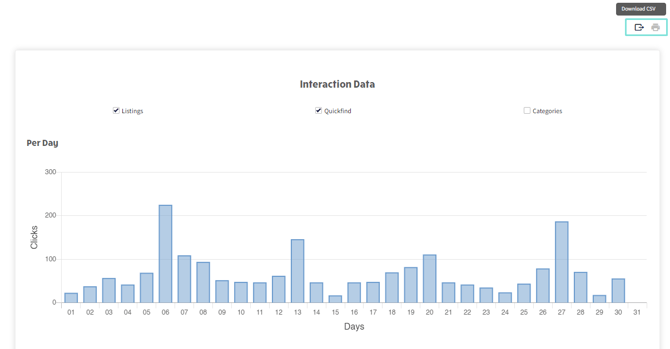
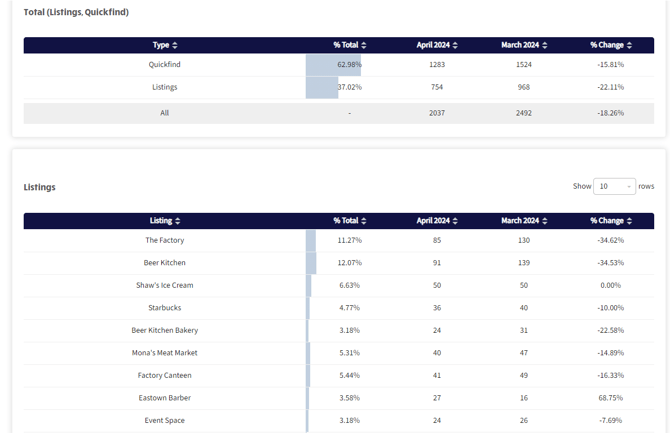
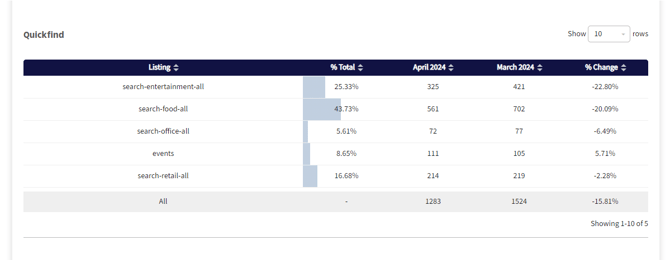
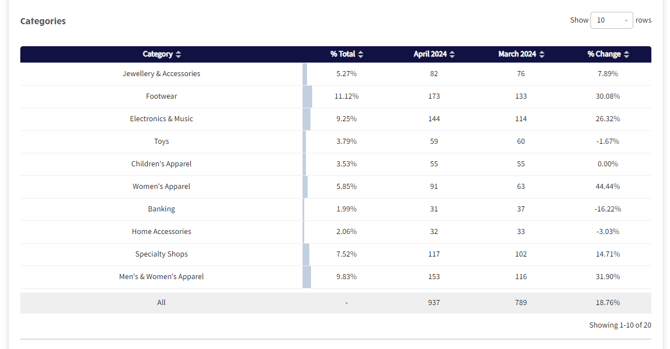
Scrolling further down shows more specific information about what users are seeking when interacting with the software. This data includes which tenants or listings are most frequently searched (Listings), and what other information is most often sought out by users (Quickfind). The "% Change" field refers to the change in frequency of searching for that particular information month-to-month.